
- Buying pressure on BTC was increasing, indicating a continued price rise.
- However, a few technical indicators hinted at a correction.
Bitcoin [BTC] investors profited greatly last week as the coin’s price rose by double digits. Thanks to the price increase, bullish sentiment around the coin increased, causing a record drop in the supply of BTC on exchanges. Will this accelerate further price increases?
Investors buy Bitcoin
CoinMarketCap’s data revealed that Bitcoin witnessed a price increase of over 11% in the last seven days. At press time, the king coin was trading at $67,866.54, with a market capitalization of over $1.34 trillion.
Actually AMBCrypto reported earlier that there were chances of BTC moving above $67k. Thanks to the recent price increase, over 50 million BTC addresses were in surplus, accounting for more than 94% of the total number of BTC addresses.
While all this was happening, an important BTC metric hit an all-time low. To be precise, Bitcoin’s supply on exchanges fell to the lowest in the last five years. A drop in this metric means that investors bought BTC in anticipation of a further price increase.
Therefore, AMBCrypto checked other data sets to find out if the buying pressure was high.
Where is BTC headed?
AMBCrypto’s analysis of CryptoQuants data established the aforementioned fact. Bitcoin’s currency reserve has fallen sharply over the past few months, indicating a clear motive by investors to buy the royal coin.
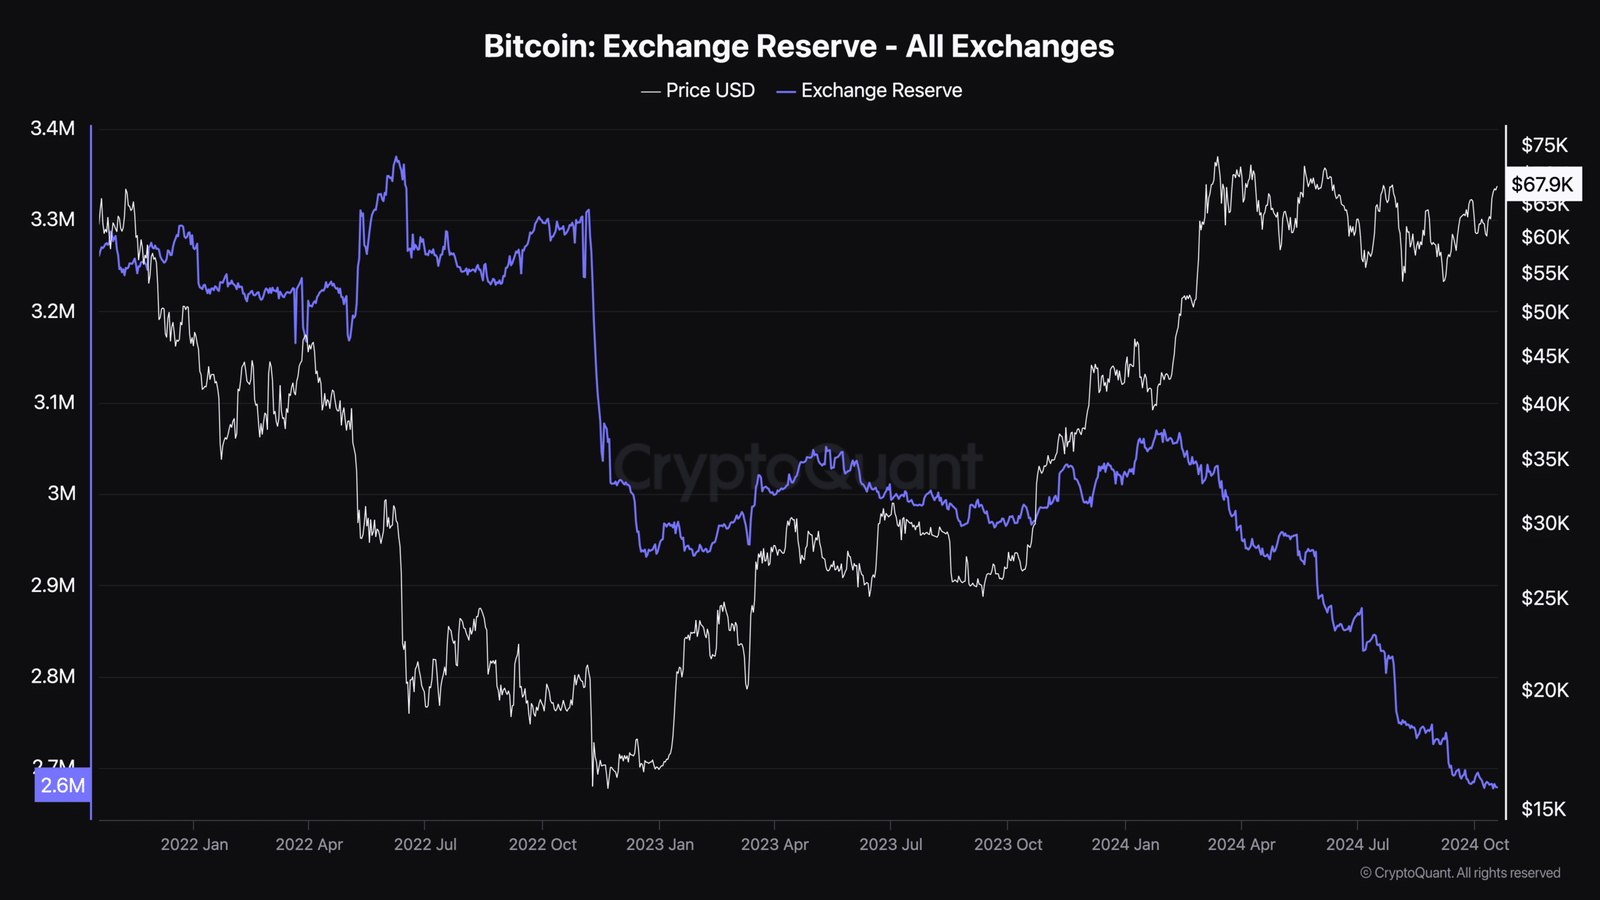
Source: CryptoQuant
Long-term holders were willing to hold their coins, as evidenced by the coin’s green binary CDD. Things in the derivatives market also looked quite optimistic.
The coin’s funding rate was increasing, which meant long traders were dominant and were willing to pay short traders. In addition, Bitcoin’s buy/sell ratio indicated that buying sentiment was dominant in the derivatives market.
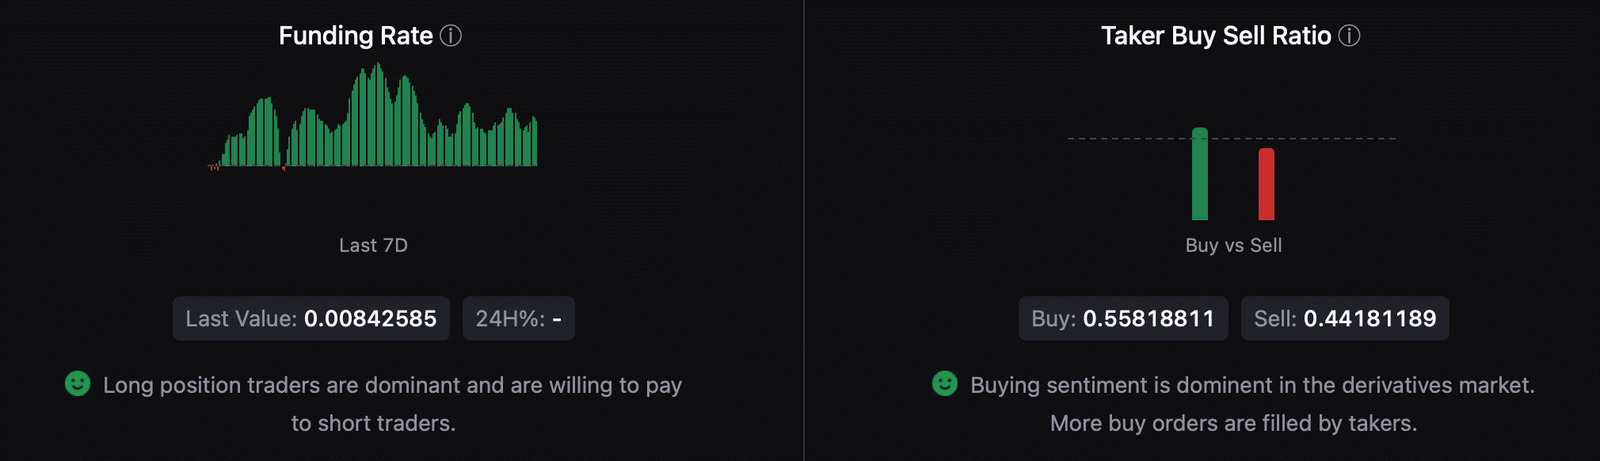
Source: CryptoQuant
However, American investors thought otherwise. This was evident from the low Coinbase premium, meaning sell sentiment among US investors was dominant. Increasing selling pressure could put an end to BTC’s bull rally.
Therefore, AMBCrypto planned to take a look at Bitcoin’s daily chart to better understand which way the king coin was heading. According to our analysis, Bitcoin tested its resistance at the $68k mark. However, the market indicators indicated a rejection.
Read Bitcoins [BTC] Price prediction 2024-2025
For example, BTC’s price touched the upper limit of the Bollinger Bands, which often causes price corrections.
Additionally, the Relative Strength Index (RSI) was also entering the overbought zone. If that happens, selling pressure could increase, which could result in a price drop in the coming days.

Source: TradingView